Organizations beginning to fleet electric vehicles enter their plans with theoretical assumptions on how they’ll be charged, operated, and maintained. But how do real-world operations compare? Surveys and real-world data analysis from Utilimarc’s Electric Vehicle Consortium (EVC) provide early answers. For two years, EVC has collected member data on usage trends, charging behaviors, maintenance patterns, and driver perceptions, which are summarized here.
FLEET EV USAGE PATTERNS
According to EVC data, electric passenger cars are functioning as true like-for-like replacements for ICE models, with average utilization rates only 0.6% lower. EV pickups, by contrast, are still evolving in their fleet roles. Average utilization remains 13% to 22% below ICE pickups but has grown from 36% in early 2023 to nearly 50% in mid-2025.
CHARGING BEHAVIOR AND PATTERNS
Most fleet EVs end their shifts with significant charge remaining — on average, 67% battery capacity. For vehicles driving at least 30 miles per shift, this equates to roughly 200 additional miles of available range, countering persistent “range anxiety.”
Utilization Patterns ICE & EVs - Pickups
Utilization Patterns ICE & EVs - Small Cars
EV utilization continues to trail ICE vehicles, though the gap is narrowing. EV pickups reached 49.6% usage by mid-2025, up from 35.9% in early 2023. Small-car EVs remain closely aligned with ICE models, suggesting electrification is more mature in lighter-duty segments.
Source: UTILIMARC’S EV CONSORTIUM
In terms of Level 2 vs. DC fast charging, L2 chargers dominate fleet use because they balance charging speed with affordability and are easier to deploy at depots.
- Level 2 chargers at typically 6–11 kW represented 68% of sessions.
- DC fast chargers represented only 6% of sessions but are increasing in use for shift-based operations.
Driver Perceptions of EV Charging Time and Access
Nearly 40% of fleet driverssaylimited charger access orcharging time interferes with their abilityto do their jobs.
Source: UTILIMARC’S EV CONSORTIUM
CHANGING PERCEPTIONS OF CHARGING ACCESS AND TIME
Compared with the previous Utilimarc driver survey, the 2025 results suggest slightly improved sentiment toward charging access but persistent frustration with charging time.
In the latest survey, just under 40% of drivers disagreed or strongly disagreed that they had access to enough charging stations — a modest improvement from the prior data, where more than 44% expressed concern over charging infrastructure.
However, attitudes toward charging time have hardened: nearly 44% of respondents now say charging interferes with their ability to do their jobs, up slightly from earlier measures. This indicates that while infrastructure availability is improving gradually, the time burden of charging remains a barrier for many drivers in operational fleets.
MAINTENANCE FREQUENCY AND PREVENTIVE SCHEDULES
Across EVC fleets, EVs require fewer demand (unscheduled) maintenance (DM) events than ICE vehicles, especially among pickups from model years 2022–2024.
Average Monthly Downtime Hours
EV pickups show roughly six more downtime hours per month than ICE models. However, many are compliance units in California public fleets — so downtime may reflect limited use and early operational cycles rather than repair complexity.
Source: UTILIMARC’S EV CONSORTIUM
Preventive maintenance intervals are 21 days longer for EVs, though some fleets still maintain monthly check-ins out of caution.
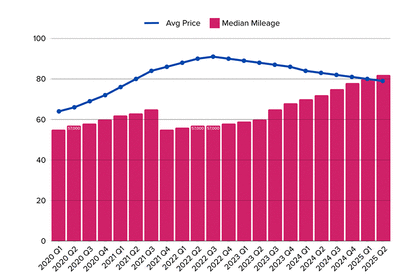
MILEAGE AND COST PERCEPTION
In the EVC, EV pickups log significantly fewer miles annually (676–2,283 mi) than ICE equivalents (3,200–14,600 mi). This lower utilization can inflate cost-per-mile metrics, making EVs appear more expensive until usage stabilizes.
As deployments scale, operating costs are expected to converge with ICE benchmarks.
DOWNTIME DRIVERS AND REPAIR LOGISTICS
Monthly downtime between EVs and ICE vehicles is nearly identical for small cars, but EV pickups average six additional hours of downtime per month. The issue stems primarily not from mechanical faults, but logistics — outsourced repairs, EV technician training, and scheduling gaps extend service time.
Fleets investing in in-house technician training are reporting reduced repair time and improved uptime. ■